
Will Kinlaw, Mark Kritzman and David Turkington recently published an interesting paper titled, “A New Index of the Business Cycle” in which they applied the Mahalanobis Distance to an ensemble of leading economic indicators to calculate the probability of a recession. After a decent amount of putzing around with the data, I was able to replicate the index myself. Overall, I found that the indicator does a pretty, pretty (Larry David voice) good job of anticipating economic recessions. I also found that many of the indicators used to construct the index were identical to the ones used in Philosophical Economics’, Growth Trend Timing model. This got me thinking, would a more accurate prediction of recessions improve the risk-return profile of Growth-Trend Timing? Now, before I reveal that answer, I want to first take a detour and explain how the index was constructed and how it could improve upon a simple trend equity strategy.
Index Construction
The paper linked above has all the detail on how to construct the index from scratch but here is the gist of it.
- Year over year change in Non-Farm Payrolls
- YoY change in Industrial Production
- YoY change in the S&P 500 price return index
- The slope of the yield curve
- Subtract Effective Fed Funds Rate from the yield on the 10-Year Treasury
- Average over the past twelve months.
We then use historical recession dates and industrial production to classify historical periods as either being recessionary or exhibiting robust growth. Robust growth is classified by comparing the current YoY change in industrial production to the 75th percentile of industrial production over the preceding 10 years. Recession dates are directly from the National Bureau of Economic Research website. Once we have successfully classified the data into periods of recession and robust growth, we calculate each subsample’s mean and covariance. We then use the Mahalanobis Distance to compare the values of our current data to those of prior periods.

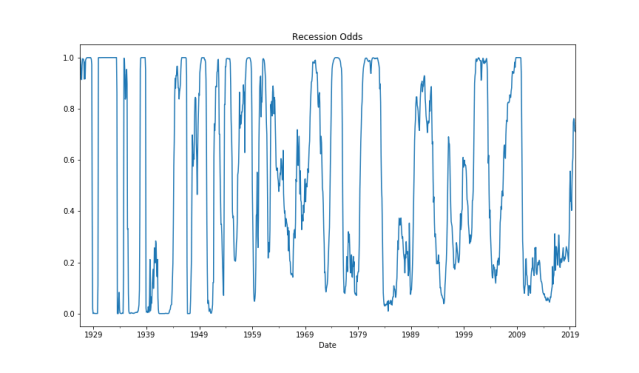
Plugging our distance values and covariance matrices into a multivariate normal distribution function we can convert the distances into likelihoods. Once we have our likelihoods we can scale them into probability weights by dividing our recession likelihood by the sum of our robust growth likelihood and our recession likelihood. The result is the index below.
Trend Equity
In its simplest form trend following is the process of buying assets when prices are trending higher or selling assets and holding cash when prices are trending lower. Historically, this strategy has rewarded investors with higher risk-adjusted returns. One of the explanations for this improved risk-return profile is that the strategy exhibits a positively convex payoff structure as can be seen in the chart below.
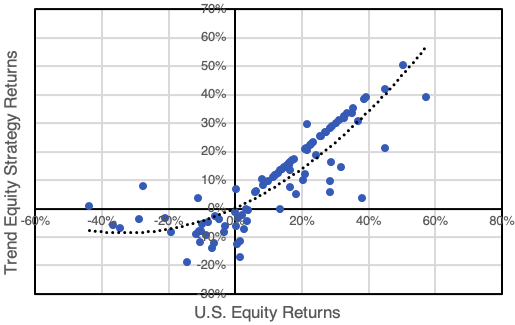
Chart via New Found Research
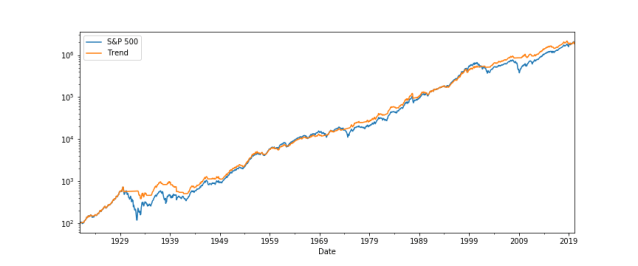
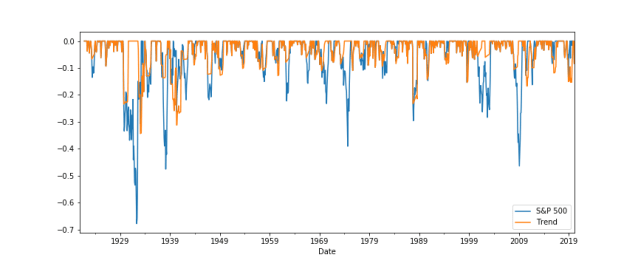
In a sense, trend equity allows investors to reap the benefits of up markets while limiting losses in down markets. Using a simple 12-month moving average signal we can see the strategy managed to keep up with the S&P 500 on an absolute basis while delivering significantly lower drawdowns.
While trend equity has done well historically, it is no free lunch. As Corey Hoffstein From New Found Research likes to say, “risk cannot be destroyed, only transformed”. Trend equity typically underperforms a buy and hold investor when the market fails to establish a clear trend and instead oscillates within a stationary range. This kind of environment typically leads investors to get whipsawed as moving average signals move them into and out of the market. For a more nuanced discussion on this topic, I’d suggest reading Philosophical Economics’ post here.
Growth-Trend Timing
To reduce the whipsaw inherent in this kind of strategy Philosophical Economics proposes using economic data to time allocations to trend equity. The logic behind this proposal is that risk begets risk and tends to persist when there is uncertainty in the economy. Using economic indicators to limit our trend equity exposure to periods of uncertainty helps to reduce the effects of whipsaw and preserves the strategy’s unique payoff structure.
A Horse Race
Now onto the model. From the website Allocate Smartly, Growth-Trend Timing is defined in the following way.
“At the close on the last trading day of the month, calculate the year over year change in Real Retail and Food Services Sales (RRSFS, a measure of economic consumption) and the Industrial Production Index (INDPRO, a measure of economic production) as of the end of the previous month. If the YOY change in either indicator is negative, signal a recession.
-
If recession is not signaled, go long the S&P 500 (SPY) at the close.
-
If recession is signaled, compare the S&P 500 (SPY) to its 10-month moving average. If it will close above the average, go long the S&P 500 (SPY) at the close, otherwise move to cash.”
For our trading model, we will use a probability threshold of 75% as the switch for our trend model.
- If the probability of a recession is greater than 75% in the previous month, check if the 10-month moving average price is less than the current price
- If the current price is less than the 10-Month Moving Average hold cash, else stay long the S&P
- If the probability of a recession is less than 75% in the previous month stay long the S&P.
The Results
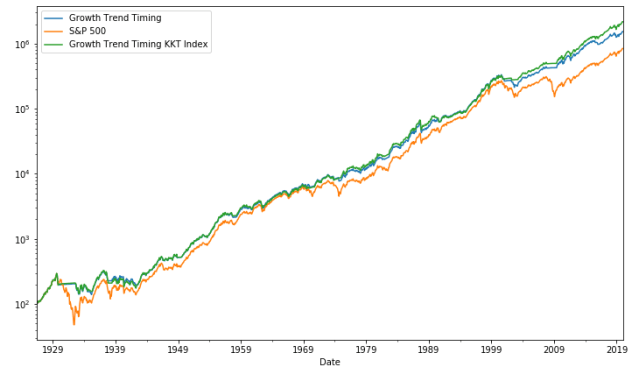
| Growth Trend Timing | Growth Trend Timing KKT Index | S&P 500 | |
| Annual Returns | 10.85% | 11.26% | 10.14% |
| Annual Volatility | 16.07% | 16.17% | 19.81% |
| Sharpe Ratio | 0.68 | 0.70 | 0.51 |
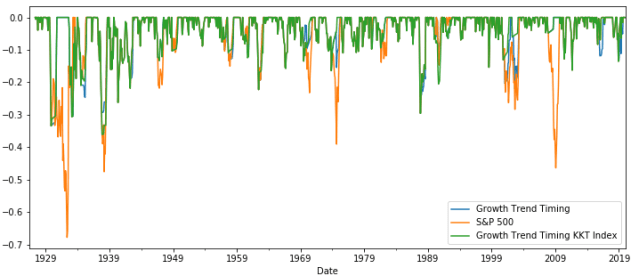
| Max Drawdown | -52.53% | -50.45% | -83.66% |
| Percent of Time in S&P | 86.01% | 85.70% | 100% |
It appears that the KKT index mildly improved our Growth-Trend Timing signal. Looking into the allocation over time it appears that the KKT was better able to anticipate recessions, specifically the recession of 1937 which the Growth-Trend Timing model failed to pick up in time.
Given the results and the simplistic approach to this analysis, I am certain a deeper dive into combining signals using the Mahalanobis Distance would be a fruitful endeavor. Some ideas I have in mind for future posts:
- Adding New Home Sales and Retail Spending
- Diversifying across trend signals and rebalance dates.
Anyways, that’s all for now. Until next time.
